Understanding LinkedIn Video Metrics in 2022

There's no better business sales platform than LinkedIn; a 2020 study by HubSpot shows that LinkedIn traffic is almost 3 times more effective in generating visitor-to-lead conversions (2.74% conversion rate) than Facebook (.77%) and Twitter (.69%).
What's the best way to get LinkedIn prospects to venture off the social network and onto your site? You guessed it -- LinkedIn members spend 3x more time watching video on the platform than consuming static content, and are 5x more likely to initiate a conversation with a brand after watching a video on that brand's Company Page. But not all videos are created equal.
How can you measure the success of your LinkedIn videos?
Now, more than ever, it’s easy to create, publish, and share video content. As you integrate video content into your digital marketing strategy, though, it's critical to build a framework for understanding how each video performs and the factors responsible for that performance.
Here are the four fundamental questions to ask when developing your video marketing strategy:
- What’s the key objective of your video campaign?
- What are the best key performance indicators (KPIs) for this objective?
- What video analytics can measure these KPIs?
- How can you optimize your campaign for better engagement?
Establishing well-defined goals and identifying the right metrics for analysis can help you better engage your professional audiences.

Understanding LinkedIn Analytics
Creating and sharing video content on LinkedIn is just the beginning of your journey.
LinkedIn analytics can be accessed from your company profile. Click the Manage Page option and you're led to a dashboard that shows your page’s traffic data in the past month. While this info's useful if you need a quick summary of your page’s performance over the last 30 days, it’s not enough to identify certain trends; the Analytics menu provides the more granular view you'll need to gain deeper insights into the behavior of visitors on your LinkedIn page.
Within the Analytics menu, you'll see three categories:
- Visitors (data on the people who visited your page)
- Updates (engagement metrics such as likes, comments, shares, and follows)
- Followers (information on the people who have subscribed to the page)
Which LinkedIn metrics should I track?
Identifying the main objective of your video campaign is key. Establishing a goal will help you figure out which LinkedIn metrics you should track to analyze and measure the success of your video content’s performance.
Here are some common objectives for video campaigns:
- Brand awareness - Videos communicating the purpose and/or values of your brand and creating an emotional response to the viewer in a short video.
- Brand consideration - Prove and market why you are better than the rest and clear any doubts your audience may have about your business.
- Lead generation - Excite people to try your product or service. Product demonstrations or promotions for an upcoming product launch can particularly effective for lead gen.
Once you've set your goals, video content can help you achieve them through rich, visual narratives tailored to fit the context of LinkedIn, allowing you to build brand awareness and drive relevant traffic to your website or app. Videos also let you gather relevant leads through call-to-action buttons or with the help of Lead Gen Forms.
In this video that we made with Stasher, the goal was to create content that aligns with their mission as a company — helping people make a more conscious effort to participate in the plastic-free movement.
Let’s look at three of LinkedIn’s most important analytics categories to understand how your data can inform your marketing strategy.
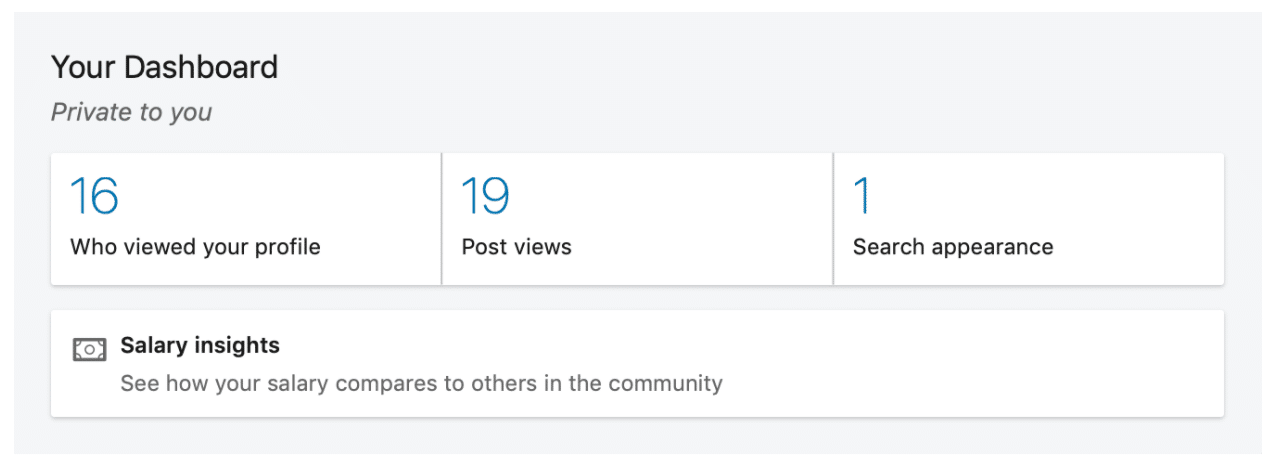
Visitor Highlights
This displays the number of views and unique visitors you gained in the past month. Next to each number, you'll see a percentage that shows how your current stats compare to last month’s figures.
Traffic Metrics
In a graph, you'll see all the page views the profile has gained over two weeks. Mobile views are reflected with a blue line while desktop views are displayed as an orange line. You can also toggle between three data filters: metric, page, and time range.
- Time range - As its name suggests, this filter lets you view data from a particular date and time.
- Metric - This shows two data categories: Page views and unique visitors. If you want to determine the effectiveness of your content, you keep an eye on the former. When you want to measure the size of your audience, you check out the latter.
- Page - Gain more insights into your page traffic by analyzing all the pages on your profiles, as well as their respective views. From this metric, you will learn what your audiences are more interested in and what they aren’t. You can update your profile to accommodate that information. As a result, you can improve engagement rates and page views.
Visitor Demographics
Understanding your audience is fundamental to marketing on LinkedIn. To make sure your campaigns are reaching the right people, keep an eye on this metric. The final section under this data category displays detailed information on LinkedIn users who are visiting your page. This metric lets you filter visitors based on the following factors:
- Job function
- Location
- Seniority
- Industry
- Company size
You don’t want a potential client to leave with more questions than they arrived with
Be sure to fill out every section of your company page in order to optimize the visitor analytics. Visitor analytics gives you data on who has visited your page, but not metrics on content performance.
Engagement Highlights
This category reflects all the likes, comments, and shares on your page over the past 30 days. Much as in visitor highlights, you’ll see a percentage that displays how your stats have changed since the preceding month.
Engagement Metrics
Here, you can take a close look at detailed statistics on different types of engagements generated within a certain period of time. Consider having a well-defined strategy before posting updates; there should be a well-defined purpose for each. You can differentiate paid from organic traffic as they're represented in different colored graphs. This includes the following metrics:
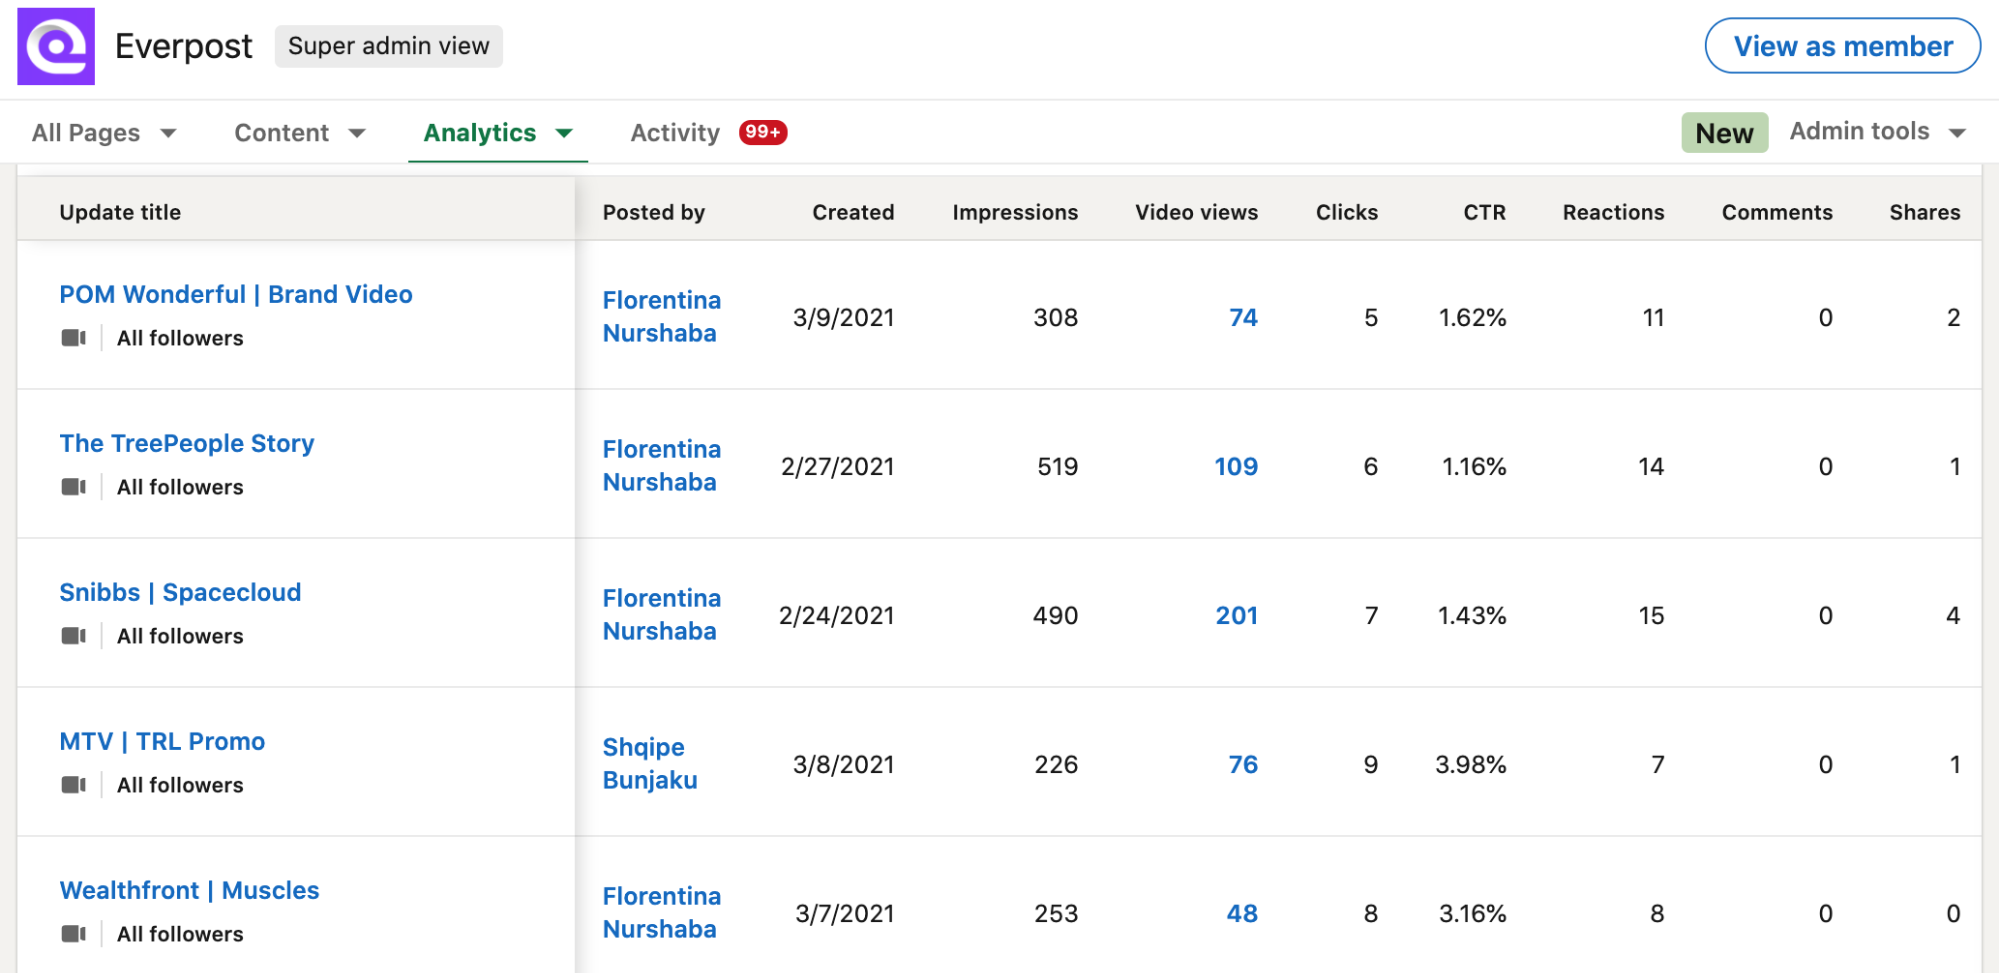
- Update Title - The title of the update you posted
- Posted by - Who on your team posted the update
- Created - The date the update was published
- Impressions - The number of times an update was shown to a user
- Video Views - When 3 seconds or more of a video was viewed, or the Call-to-Action (CTA) was clicked
- Clicks - The number of times your update or company branding was clicked
- CTR (Click Through Rate) - Clicks divided by impressions
- Likes - Number of likes on your update
- Comments - Number of comments on your update
- Shares - Number of update shares
- Follows - Number of people who click ‘follow’ on your sponsored updates
- Engagement Rate - (Clicks + Likes + Comments + Shares + Follows / Impressions)
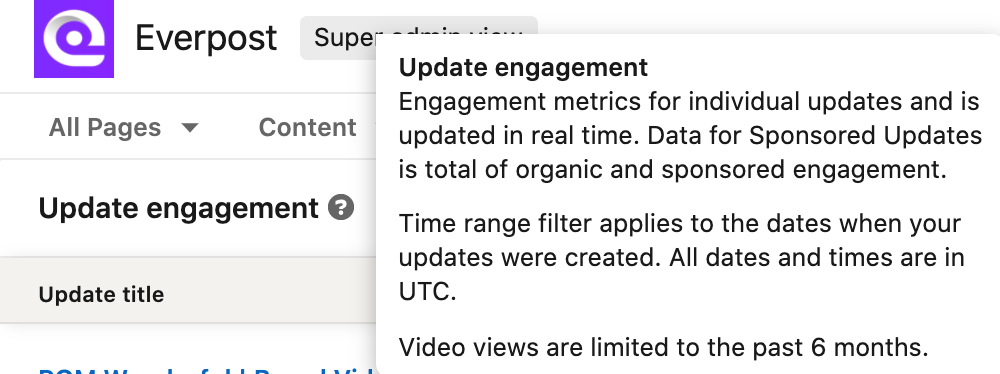
Update Engagement
LinkedIn lists all your content with their respective data in this table. You can browse through the titles to better understand your data. All video content will have a video icon below the item’s title.
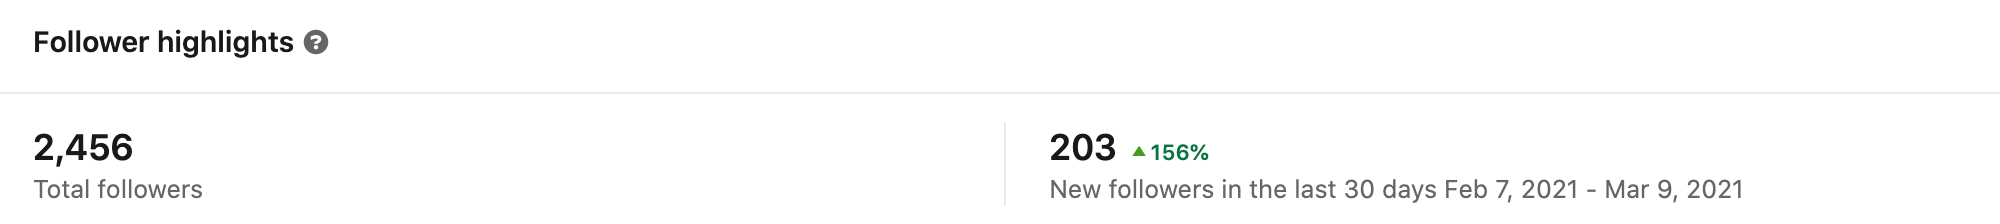
Follower Highlights
Are they liking what you’re saying?
This shows an overview of the page’s total follower count. It also displays the number of followers you’ve gained within a month and how that compares to the month before.
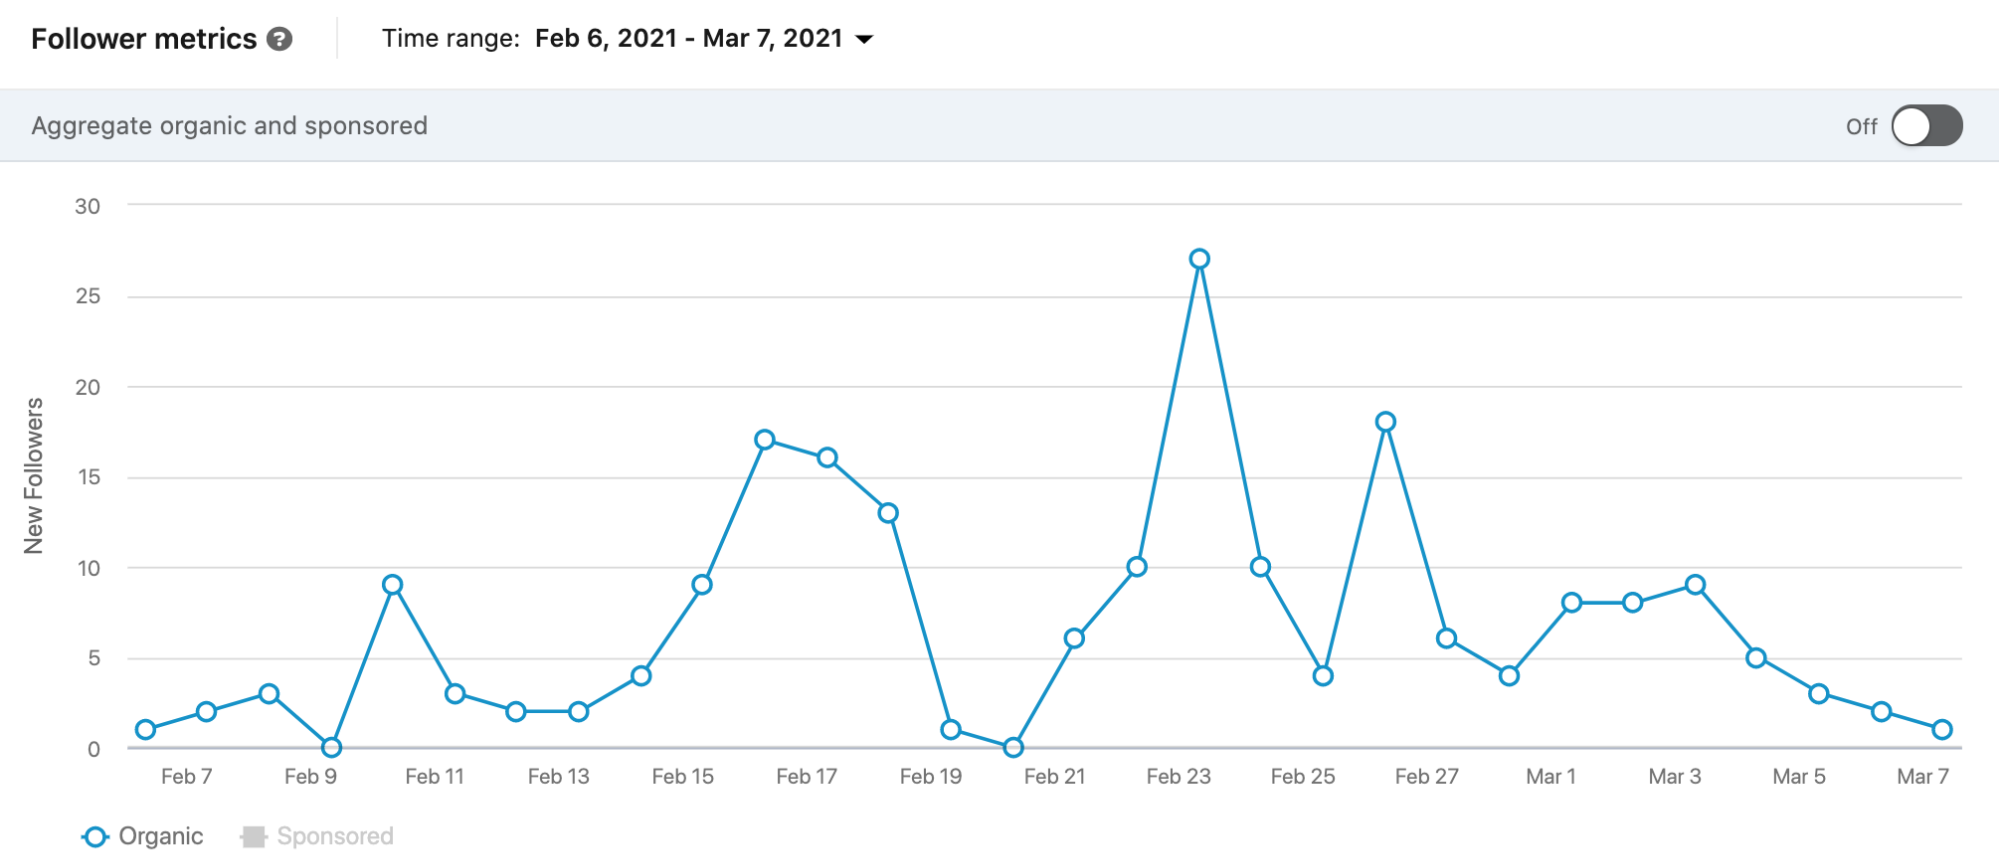
Follower Gains
Use the graph in the Follower analytics tab to track growth patterns. Although this graph, by default, maps out your follower growth in the past month, it allows you to toggle between different time periods from a week to a year. This graph displays two important metrics: organic traffic, which is represented as a blue line, and paid traffic, which is in orange.
To ensure you make the most out of your paid and sponsored content, pay attention to this metric.
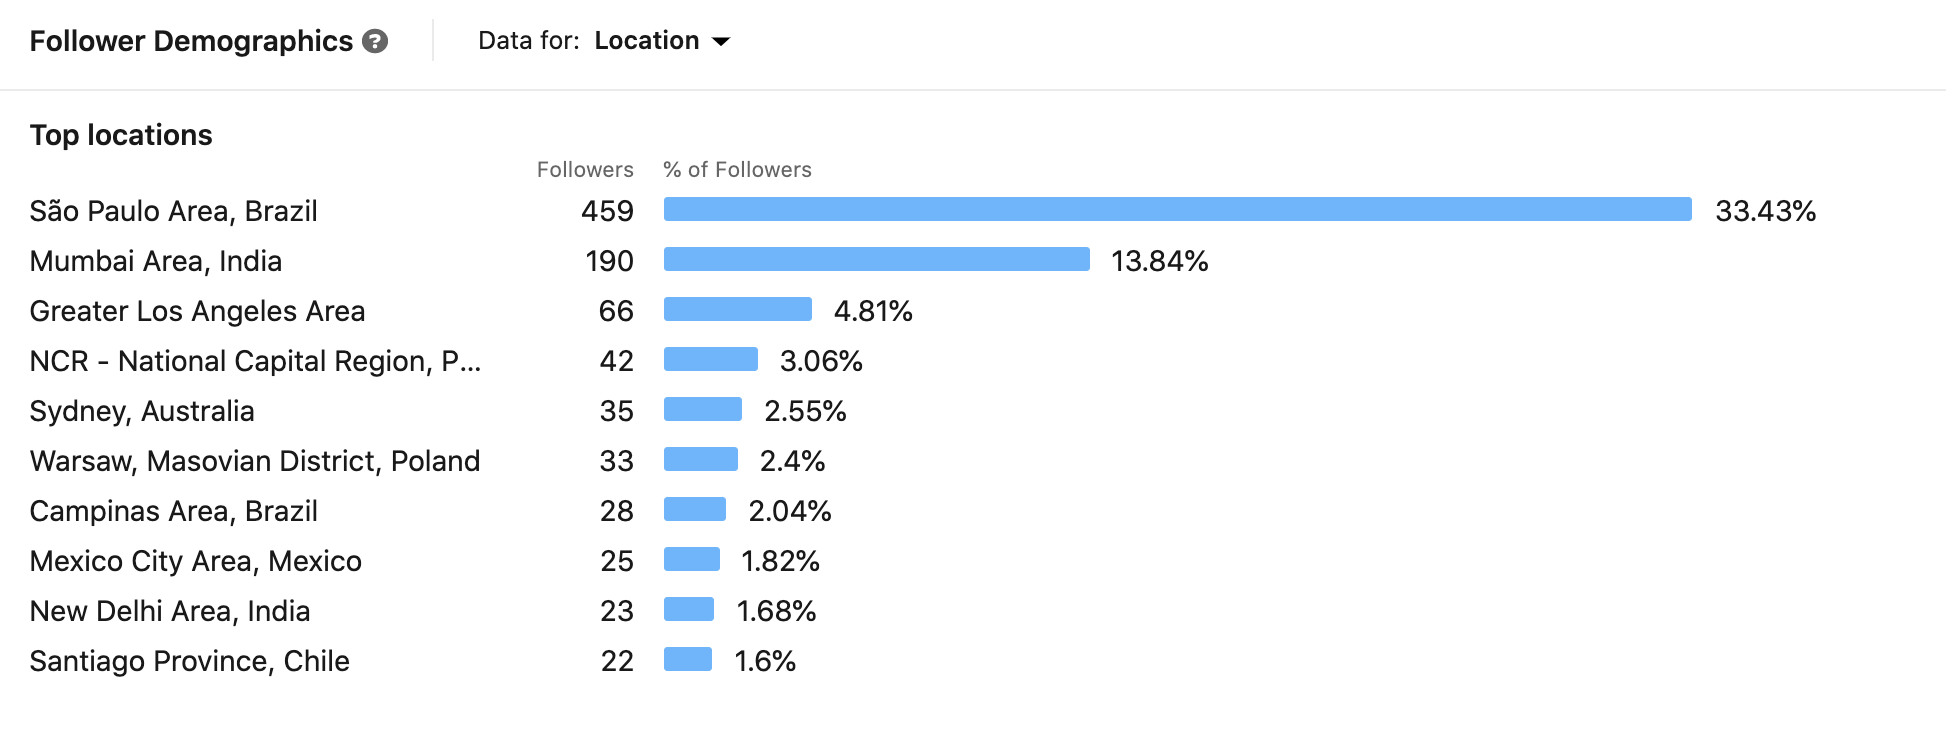
Follower demographics
It's not just about reaching an audience and having a large audience — know that you're reaching the right audience. Get to know your audience by following this metric. This tells you who’s been following your page, where they're from, what industry they're in, and more. You can compare this with your visitor demographics to identify an underserved category.
Companies To Track
How is your company faring against the competition? LinkedIn will give you an answer here, showing how your profile compares to other companies from the same niche through the following metrics:
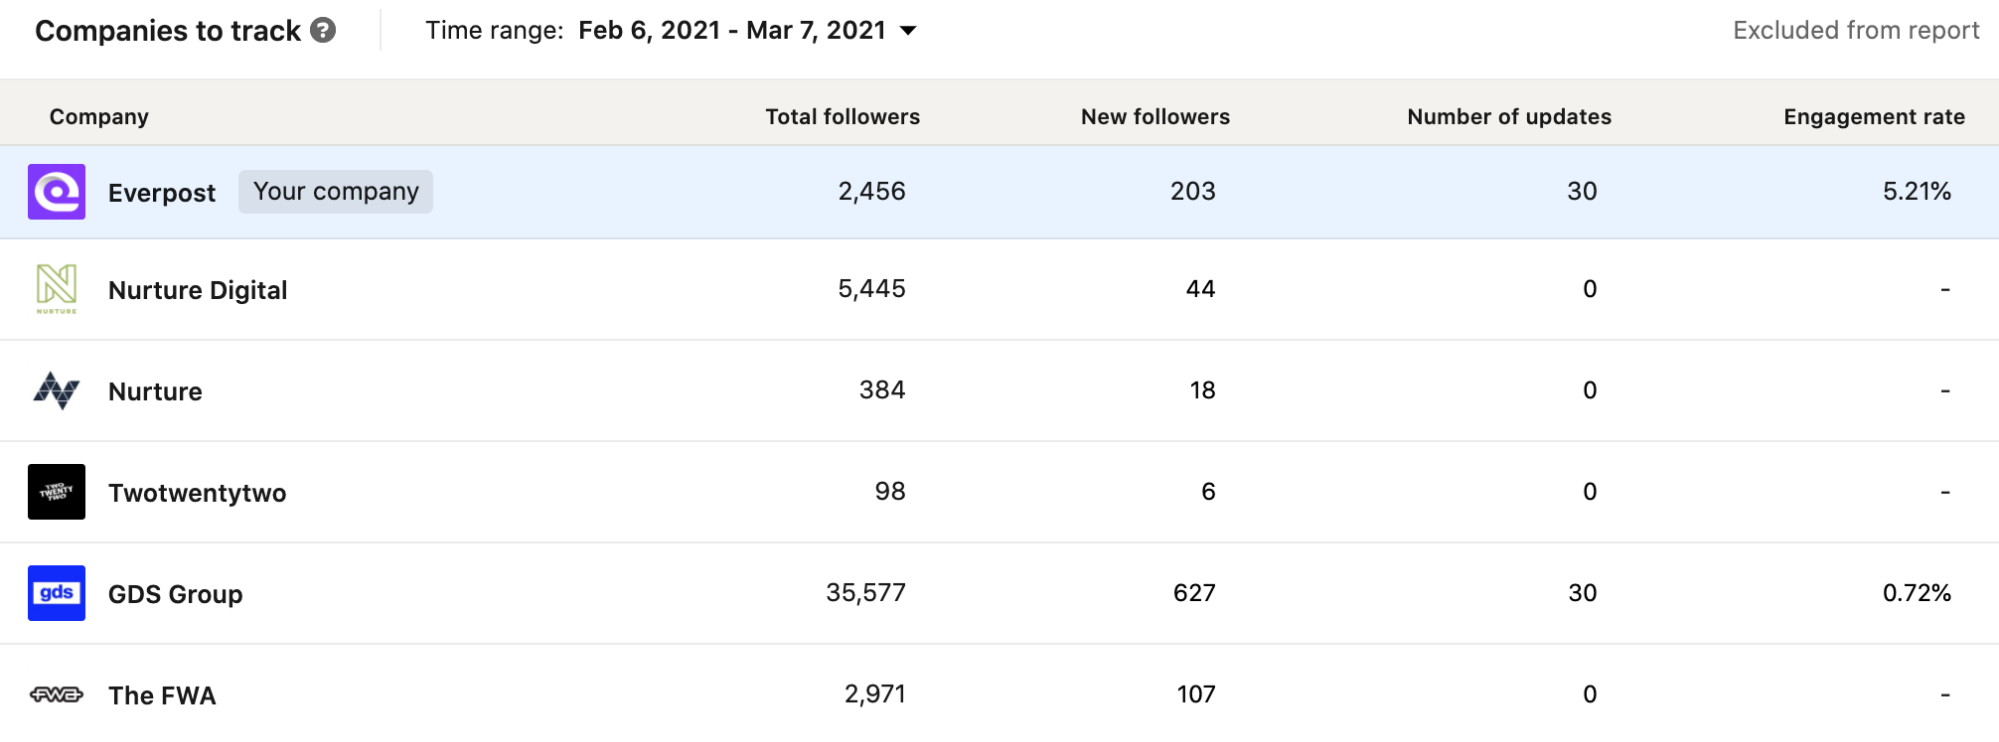
- Total followers
- New followers vs. your company
- Number of updates vs. your company
- Engagement rate vs. your company
This metric tells you if your page is outperforming the competition or if it is lagging. From here, you can click on their profile to understand what they’re doing to reach target audiences and keep them engaged. All in all LinkedIn analytics metrics are the blueprints of your LinkedIn marketing efforts.

Bottom Line
Having such a wide array of metrics available with which to measure the performance of your videos can seem overwhelming at first, but focus on improving just one or two at first and before you know it all your metrics will be moving in the right direction. For example, spend a week posting your LinkedIn videos at the busiest times of day on the most active days of the week and your engagement will start climbing. The following week, focus on optimizing the content of those videos and your conversion metrics should start to climb.
Over 50% of LinkedIn members engage with videos on their feed on a daily basis. To succeed with your video marketing campaign, identify your goals and then determine the right KPIs to measure its success. Evaluating the right metrics and understanding how they relate to your goals will lead you to successful LinkedIn video marketing.
Now let’s get down to business, shall we?
Research links
- https://business.linkedin.com/marketing-solutions/blog/linkedin-b2b-marketing/2017/10-surprising-stats-you-didnt-know-about-marketing-on-linkedin
- https://business.linkedin.com/marketing-solutions/native-advertising/lead-gen-ads
- https://blog.hootsuite.com/linkedin-analytics/
- https://sproutsocial.com/insights/linkedin-analytics/
- https://buffer.com/resources/linkedin-page-analytics/
- https://www.socialpilot.co/linkedin-analytics-tools
- https://blog.hubspot.com/blog/tabid/6307/bid/30030/LinkedIn-277-More-Effective-for-Lead-Generation-Than-Facebook-Twitter-New-Data.aspx